


The Dow Jones Industrial Average (US30) is recovering after the 10% sell-off suffered in late Q3, showing strength and momentum as long as the uptrend holds above 50,000–50,550. Most banks expect more gains: the median of their year-end S&P 500 targets implies about 54,600 on the Dow (NAGA calculation), close to the 54,500 median in Reuters’ August poll. The next tests are the Fed decision on October 28, big-tech earnings, the November 3 midterms and the December 9 Fed decision, where markets price about an 80% chance of another hike. On NAGA’s US30 chart, the uptrend holds while the Dow stays above 50,000–50,550.
Why has the Dow been rising? Three forces carried the 2026 advance: AI investment, which has driven tech earnings; overall earnings growth that analysts expect to top 30% for the S&P 500 this year (FactSet); and strong results from banks such as Goldman Sachs, the Dow’s heaviest stock. Ceasefire hopes in the Iran war added fuel from May to early August.
What is the risk now? The Fed has switched from cutting to hiking, the 10-year Treasury yield is near 5%, oil is back above $110 and the rally still depends on a narrow group of AI stocks. “Dividend-oriented stocks have also been comparatively weak, while the Dow has lagged the stronger technology-heavy indices. This suggests that the current rally should not automatically be interpreted as broad-based market strength,” writes Frank Walbaum, Market Analyst at NAGA and a former hedge fund manager, in his Q4 2026 Market Outlook.
Key Dow Jones Forecast & Price Predictions - Summary
- Dow Jones forecast for year-end 2026: Most bank targets imply the Dow finishing the year near or slightly above its August record. Key catalysts: the Fed decisions on October 28 and December 9, big-tech and Nvidia earnings, the November 3 midterms and oil prices.
- FORECASTERS’ BASE CASE — 54,000–55,000: Earnings keep growing, the Fed pauses or hikes only once more, and oil stays volatile without a new spike. The Dow returns toward its record by year-end, in line with the median bank S&P 500 target of 8,000 (about 54,600 on the Dow) and the Reuters poll median of 54,500.
- BULL CASE (illustrative) — 55,000–58,000: A lasting US–Iran deal pulls oil back below $100, the Fed pauses in December and AI earnings keep beating. The Dow breaks above its record and heads for the top of its rising channel, near 56,700 on October 27 and rising about 700 points a month.
- BEAR CASE (illustrative) — 45,000–50,000: The Fed signals more hikes, yields climb back above their October high and oil spikes on renewed strikes, or doubts about AI spending spread from tech to the wider market. A weekly close below 50,000 would break the channel and open the March low near 45,000.
- Dow Jones price prediction 2027: Most banks that have published 2027 or 12-month S&P 500 targets see 8,300–8,800, which would equal roughly 56,600–60,000 on the Dow (NAGA calculation), with earnings expected to grow about 16% (FactSet consensus). Bank of America’s 12-month target is lower, at 7,800, and Capital Economics expects the S&P 500 at 6,500 by the end of 2027.
- Dow Jones price prediction for the next 5 years: In 2024, Ed Yardeni said the Dow could reach about 60,000 by 2030 in his “Roaring 2020s” scenario. He now targets 10,000 for the S&P 500 by the end of the decade, roughly 68,000 on the Dow (NAGA calculation). Janus Henderson’s Jeremiah Buckley has called 60,000–70,000 a reasonable three-year target (February 2026).
With NAGA.com, you can trade Dow Jones through CFDs if you want to speculate on price movements or invest in Dow stocks or ETFs.
Dow Jones Forecast 2026 – Q4 Fundamental Outlook
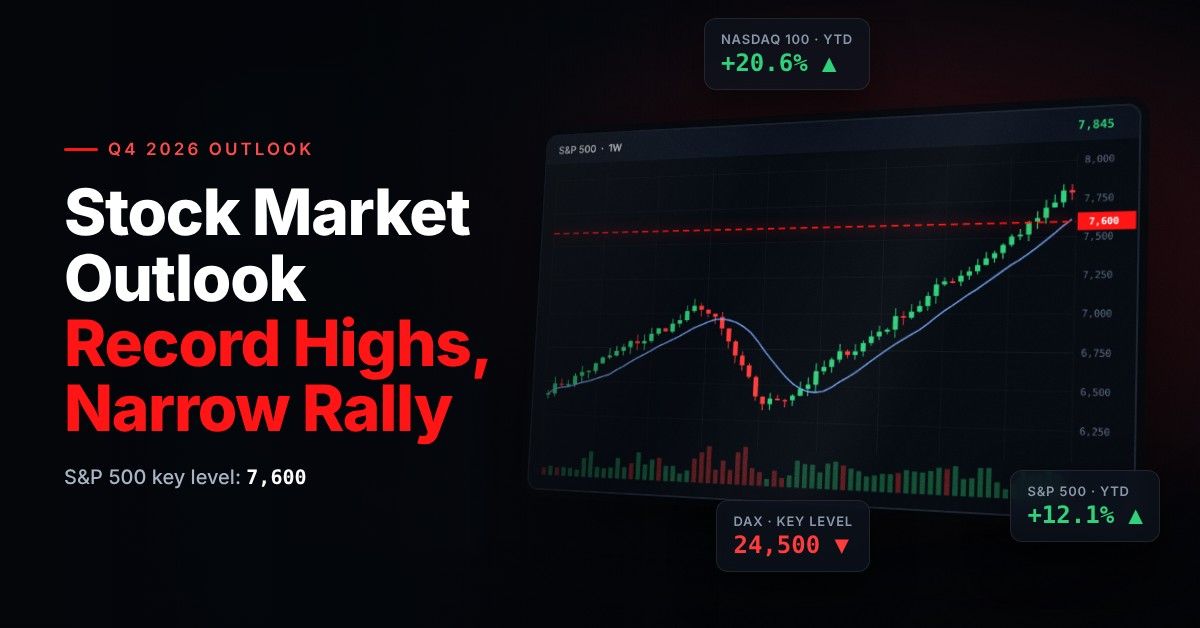
The Dow has gained 8.9% in 2026 to October 26, behind the S&P 500 (+12.1%) and the Nasdaq Composite (+12.6%). Its price-weighted mix of banks, industrials and healthcare makes it less exposed to the AI trade than the tech-heavy indices. That cost it in September, when the Dow fell 4.3% while the Nasdaq rose 1.9%, but helped on October 22, when the Nasdaq dropped 2.6% and the Dow closed flat.
The Iran-War paradox: the single biggest swing factor
The US–Iran war that began on February 28 has driven the Dow’s biggest swings this year. The oil shock pushed the index into a correction on March 27, when it closed at 45,166.64, about 10% below its February record. Ceasefire hopes and a June memorandum then carried it to a string of records, ending at 54,349.12 on August 5. Since the truce broke down in July and fighting escalated in late August, oil has climbed back above $100, and Brent closed above $116 on October 23, its highest level since the spring.
The paradox remains: the war hurts stocks mainly through oil, inflation and the Fed. A lasting deal that reopens the Strait of Hormuz would lower oil prices and inflation pressure, weaken the case for more Fed hikes and support the cyclical stocks that dominate the Dow. On October 26, Brent fell more than 6% intraday on reports of regional talks in Tehran, and the Dow rose 0.3%. This binary outcome remains the main swing factor for the Dow into 2027.
Federal Reserve: the next move is everything
The Fed cut rates three times in late 2025, to a 3.50–3.75% range, then held through July as the oil shock lifted inflation. On September 16 it raised rates by 25 basis points to 3.75–4.00%, its first hike since 2023, and Chair Kevin Warsh said: “The plain fact is that inflation is too high and has been for too long.” September CPI then came in at 3.7%, above forecasts. Markets expect the Fed to hold at its October 27–28 meeting but price about an 80% chance of another hike on December 9, even though September payrolls rose by just 29,000.
Frank Walbaum’s outlook frames the dilemma: weak data could make the Fed more cautious, weaken the dollar and support stocks, while strong data would do the opposite. A pause in December would help Dow financials and cyclicals; a hike with hawkish projections would test the uptrend.
Corporate earnings: still the bedrock
Earnings are why the uptrend has held despite higher rates. Analysts polled by FactSet expect S&P 500 earnings to grow 33.1% in 2026 and 16.0% in 2027, and with 24% of companies reporting by October 23, third-quarter growth was tracking 29.5%, with 83% beating estimates. Among Dow members, Goldman Sachs, Travelers and American Express beat profit forecasts, UnitedHealth, Honeywell and Johnson & Johnson raised their full-year guidance, and JPMorgan missed. The heaviest test comes now: Microsoft reports on October 28, Caterpillar and Amazon on October 29, Apple on November 2, and Nvidia around November 18.
Valuations, Breadth and the AI Bubble Question
Valuations are high but no longer extreme, because earnings have grown faster than prices. The Dow’s forward P/E was about 19.1 on October 23, based on the SPDR Dow Jones Industrial Average ETF Trust (DIA), and the S&P 500’s was 18.7, below its five-year average of 19.8 (FactSet). The bigger concern is breadth, because the rally is concentrated in AI stocks. Hyperscalers are spending about $800 billion on AI this year, and doubts about the return on that spending triggered the October 22 tech sell-off. “Every index on the planet is basically an AI index,” Matt Miskin of Manulife John Hancock said that day. Capital Economics calls the market a “late-stage bubble” and expects the S&P 500 to fall to 6,500 by the end of 2027, while most banks see earnings carrying the index higher.
Dow Jones Technical Analysis: Q4 2026 and 2027 Outlook
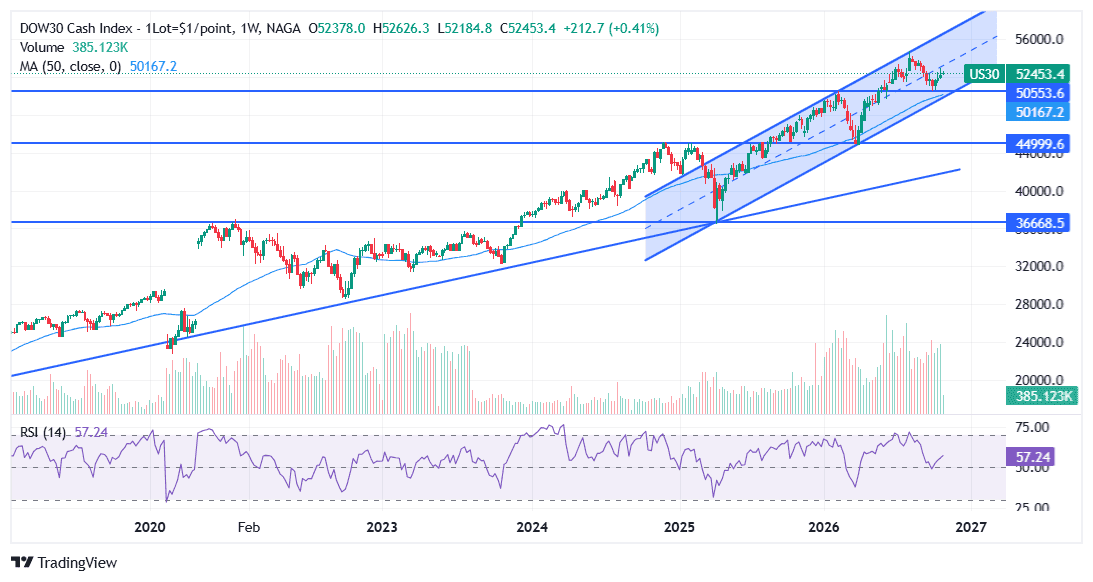
On NAGA’s US30 (Dow Jones cash) weekly chart, the uptrend that began at the April 2025 low is intact. The September–October pullback stopped where the trend’s supports meet, between 50,000 and 50,550, and the index has since recovered to about 52,500.
US30 Weekly Chart: Rising Channel From the April 2025 Low
Since the tariff-shock low of 36,668.5 in April 2025, the Dow has climbed inside a rising channel, shaded on the chart. Its lower line was near 50,000, its dashed midline near 53,400 and its upper line near 56,700, and all three rise by roughly 700 points a month. The channel has passed two tests this year. The March 2026 Iran-war sell-off stopped at 45,000, the level of the late-2024 highs and of the channel floor at the time. The September–October pullback stopped at 50,550, the February 2026 high, which has turned from resistance into support. The record on this chart, about 54,600 in early August, was set at the top of the channel.
Past performance is not a reliable indicator of future results. All historical data, including but not limited to returns, volatility, and other performance metrics, should not be construed as a guarantee of future performance.
For the long-term trend, 50,000–50,550 is the key reference zone. It is where the channel floor, the February 2026 high and the 50-week moving average (50,167 on October 27) meet. Weekly closes above the midline near 53,400, and then above the August record, would put the channel top, near 56,700 and rising, back in view. Weekly closes below 50,000 would break the channel and expose the March low at 45,000. Below that, the long-term rising trendline drawn from the 2020 lows, which the April 2025 low also tested, sits near 42,000. Weekly RSI is 57: momentum has cooled from about 70 at the August high without turning negative.
Key Technical Levels for Q4 2026
Level Price Technical Significance Channel Top (Rising) ~56,700 Upper line of the channel from the April 2025 low; rises about 700 points a month Record High (US30 Cash) ~54,600 Early-August peak at the channel top; the Dow’s record close is 54,349.12 (August 5) and its intraday high 54,744.33 (August) ⬤ Current Zone 52,000–53,400 Between key support and the channel midline (~53,400); see the live price above Key Support 50,000–50,550 Channel floor, February 2026 high (50,553.6) and 50-week MA (50,167); held the October pullback Support 2 45,000 March 2026 Iran-war low and the late-2024 highs (44,999.6) Long-Term Trendline ~42,000 Rising trendline from the 2020 lows; rises about 3,400 points a year April 2025 Low 36,668.5 Tariff-shock low and start of the channel; a break would end the post-2025 uptrend Past performance is not a reliable indicator of future results. Technical levels are analytical reference points read from NAGA’s US30 weekly chart on October 27, 2026, not price forecasts.
Will the Dow Jones rise in the coming months?
The bullish case rests on earnings. FactSet’s consensus expects S&P 500 earnings to grow about 33% in 2026 and 16% in 2027, and most of the banks in the table below expect the S&P 500 to end the year 3–6% above its October 26 close. “The bullish scenario remains valid as long as risk appetite remains strong and earnings expectations continue to support valuations,” Walbaum writes, adding that a temporary dollar correction could give stocks extra support. Technically, the uptrend stays intact as long as the Dow holds above 50,000–50,550 on a weekly closing basis; a weekly close above the August record would reopen the path to the channel top.
Will the Dow Jones Fall? Crash Risk Into 2027
Walbaum’s stock market outlook lists what would turn the picture bearish: fading AI momentum, weaker earnings expectations, rising yields, stronger-than-expected inflation, renewed dollar strength and deteriorating market breadth. Several of those are live risks. The Fed raised rates in September and markets price another hike in December, September inflation came in hotter than expected, and the 10-year yield is near 5%. Bank of America’s 7,400 year-end target sits below the S&P 500’s current level, Morgan Stanley’s Mike Wilson sees a possible dip in the S&P 500 to 7,100–7,200 first, and Capital Economics expects 6,500 by the end of 2027. On the chart, weekly closes below 50,000 would open 45,000, about 14% below the October 26 close: a deep correction, but still above the April 2025 low.
Dow Jones Price Predictions from Banks & Experts
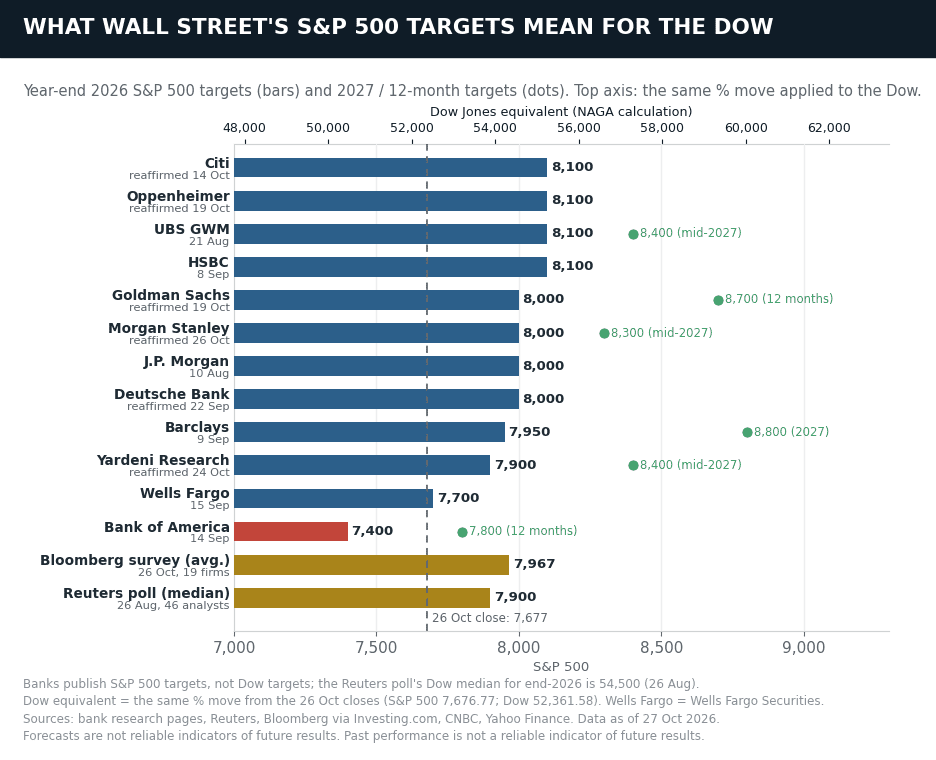
Wall Street banks publish targets for the S&P 500, not the Dow. The latest Bloomberg survey of 19 strategists (October 26) puts the average year-end 2026 target at 7,967, and the median of the 15 targets set or reaffirmed since July is 8,000 (NAGA calculation), about 4% above the S&P 500’s October 26 close of 7,676.77. The same move would take the Dow to roughly 54,600 by year-end, close to the 54,500 Dow median in Reuters’ August poll of 46 analysts. Targets change often: J.P. Morgan alone has changed its 2026 target four times this year. These are the latest calls:
Institution Year-End 2026 Target Bias Key Thesis Citi S&P 500 8,100 (reaffirmed Oct 14) Bullish AI-driven earnings; needs the rate-sensitive half of the market to recover, with the 10-year yield at 5.22% (Oct 14) Oppenheimer S&P 500 8,100 (reaffirmed Oct 19) Bullish 2026 EPS estimate raised to $365 (+35.8%); sees further upside before year-end UBS Global Wealth Management S&P 500 8,100 (Aug 21); 8,400 by mid-2027 Bullish Earnings beats broadening beyond tech; AI demand HSBC S&P 500 8,100 (Sep 8) Bullish $360 EPS at 22.5x; turned tactically neutral on Oct 26 but stays bullish for 2027 Goldman Sachs S&P 500 8,000 (reaffirmed Oct 19); 8,700 in 12 months Bullish Earnings growth to “decelerate, not collapse” Morgan Stanley S&P 500 8,000 (reaffirmed Oct 26); 8,300 by mid-2027 Bullish Correction in its “final innings”; a dip to 7,100–7,200 possible first J.P. Morgan S&P 500 8,000 (Aug 10, from 7,800) Bullish Broad Q2 earnings beats; AI spending starting to pay off Deutsche Bank S&P 500 8,000 (reaffirmed Sep 22) Bullish Broad earnings growth; 2027 EPS estimate $420 Barclays S&P 500 7,950 (Sep 9, from 7,800); 8,800 for 2027 Moderately bullish AI-driven earnings; higher rates cap valuations Yardeni Research S&P 500 7,900 (cut from 8,400 in mid-September; reaffirmed Oct 24) Moderately bullish 10-year yield near 5%, a hawkish Fed and the risk of Middle East escalation Wells Fargo S&P 500 7,700 (Sep 15, cut from 7,950) Neutral Late-cycle market, record equity allocations and AI-spending math Bank of America S&P 500 7,400 (Sep 14, from 7,100) Bearish Lowest on the Street; sees an overdue pullback and higher inflation than markets price Bloomberg survey (average of 19) S&P 500 7,967 (Oct 26) Moderately bullish Down slightly from 7,976 in September Reuters poll (median of 46) Dow 54,500; S&P 500 7,900 (Aug 26) Moderately bullish Up from 52,500 and 7,620 in May; risks: Iran, the Fed and the midterms Sources: bank research pages and notes as reported by Reuters, Bloomberg (via Investing.com), CNBC and Yahoo Finance, plus Oppenheimer and Yardeni Research. Targets are shown as each bank published them; the Reuters poll is the only current source with a Dow median. Bias compares each target with the S&P 500’s October 26, 2026 close of 7,676.77 (Bullish: 4% or more above; Moderately bullish: 2–4%; Neutral: within 2%; Bearish: below). Forecasts as of October 27, 2026; targets change frequently.
Past performance is not a reliable indicator of future results. All historical data, including but not limited to returns, volatility, and other performance metrics, should not be construed as a guarantee of future performance.
Dow Jones Forecast 2027: What Banks Expect
Few banks have published 2027 targets yet; most release their 2027 outlooks in mid-to-late November. Those that have point higher. Morgan Stanley sees the S&P 500 at 8,300 by mid-2027, and Mike Wilson told CNBC on October 20 that “8,500 could be achievable by the middle part of next year.” UBS and Yardeni Research both see 8,400 by mid-2027, Goldman Sachs 8,700 in 12 months and Barclays 8,800 for 2027. The same moves would put the Dow at roughly 56,600–60,000 (NAGA calculation).
Earnings are the main support: FactSet’s consensus expects S&P 500 earnings per share to grow 16% in 2027 (October 23). The bear case comes from Capital Economics, which expects the S&P 500 to fall to 6,500 by the end of 2027, about 44,300 on the Dow, as what it sees as a bubble deflates. Bank of America’s 12-month target of 7,800 implies only modest gains. For the Dow itself, Janus Henderson portfolio manager Jeremiah Buckley called 60,000–70,000 “a reasonable three-year target” in February 2026.
Dow Jones Price Prediction 2026–2027 From AI-Based Websites
Algorithmic forecast sites are less optimistic than the banks for the next few months. LongForecast’s model (updated October 27) has the Dow at 50,598 at the end of 2026 and 66,214 at the end of 2027. Trading Economics’ macro model sees 51,108 at the end of the quarter and 47,926 in 12 months, the most bearish projection here. WalletInvestor’s model points to 52,181 in December 2026, 56,248 in a year and 67,051 in five years. These models extrapolate prices and macro data; they do not account for earnings, Fed decisions or geopolitical shocks.
Dow Jones Companies: Top 10 by Weight (October 2026)
The DJIA is price-weighted: a stock’s influence depends on its share price, not its market value. With the divisor at about 0.1682 since June 29, 2026, every $1 move in any component moves the Dow by about 5.94 points. The top 10 components below account for about 54% of the index. On June 29, Alphabet replaced Verizon in the Dow.
# Company Ticker Weight Q3 2026 Earnings 1 Goldman Sachs GS 10.15% Beat estimates (Oct 13) 2 Caterpillar CAT 7.87% Due Oct 29 3 Microsoft MSFT 6.04% Due Oct 28 4 Amgen AMGN 5.03% Not yet reported 5 UnitedHealth Group UNH 4.66% Guidance raised (Oct 13) 6 Visa V 4.59% Due Oct 27 7 Travelers TRV 4.53% Beat estimates (Oct 16) 8 Apple AAPL 3.90% Due Nov 2 9 Sherwin-Williams SHW 3.80% Due Oct 27 10 JPMorgan Chase JPM 3.80% Missed EPS estimate (Oct 13) Weights from Slickcharts, October 26, 2026. The Dow divisor has been 0.16824816528350 since June 29, 2026, so every $1 change in a component’s share price moves the index by about 5.94 points. Goldman Sachs alone (10.15% weight) has about four times the index influence of Nvidia (2.46%).
Dow Jones Stocks to Watch in Q4 2026
With the third-quarter earnings season under way, these Dow members matter most for the index into year-end, either because of their weight in the price-weighted index or because their results test the AI trade:
Stock Q3 Report Result Key Q4 2026 Catalyst Nvidia (NVDA) ~Nov 18 (not yet confirmed) Pending First big AI-spending test after the Oct 22 chip sell-off; N1X PC chip unveiled at Computex in June Goldman Sachs (GS) Oct 13 EPS $17.01, well above estimates Heaviest Dow stock (10.15%); M&A and IPO pipeline Microsoft (MSFT) Oct 28 (after the close) Pending Azure growth versus AI spending; third-largest weight (6.04%) 3M (MMM) Oct 20 Adj. EPS $2.50 (+12%); shares +5.1% Amazon data-centre deal; full-year guidance $9.10–9.15 Johnson & Johnson (JNJ) Oct 13 EPS beat; MedTech miss; shares −5% Full-year EPS guidance raised to $11.05–11.15 UnitedHealth Group (UNH) Oct 13 Revenue $112.7bn; guidance raised Medical-cost trends; fifth-largest weight (4.66%) Caterpillar (CAT) Oct 29 (before the open) Pending AI data-centre construction and power demand; second-largest weight (7.87%)
Key Factors That Will Drive the Dow into 2027
Seven factors will decide whether the Dow returns to its August record by year-end or breaks below its uptrend. The next six weeks are unusually busy: two Fed decisions, the US midterm elections, the October jobs and inflation reports, and the rest of the earnings season.
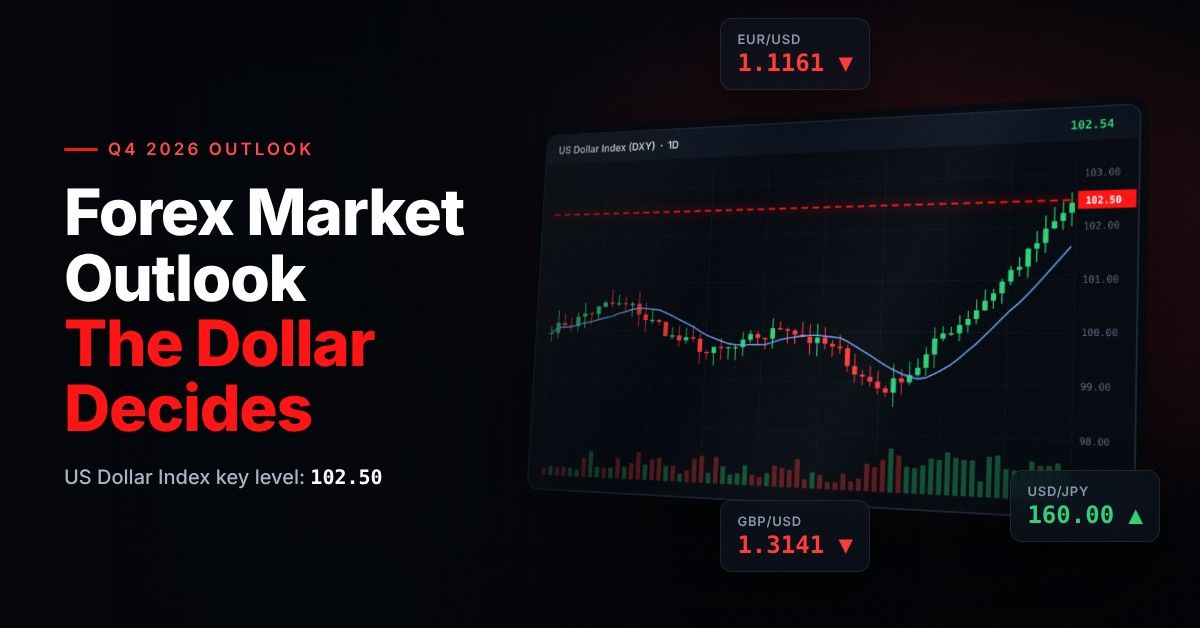
Factor Bull Impact Bear Impact Iran war / Strait of Hormuz Talks or a deal → oil below $100 → less pressure on the Fed → Dow rallies Renewed strikes → oil above $120 → hike bets rise → risk-off Fed decisions (Oct 28 / Dec 9) A pause or softer guidance → relief for financials and cyclicals A December hike with hawkish projections → yields above 5% → sell-off Q3 earnings (Oct–Nov) Growth near 30% (FactSet) supports valuations; Microsoft, Apple and Nvidia pivotal AI-spending doubts → tech sell-offs like October 22 Oil (Brent crude) Back below $100 → inflation eases; equities re-rate Sustained above $115 → inflation shock; more hikes AI capex signals Monetisation catches up with spending → Microsoft, Nvidia, Apple lead Funding strain or capex cuts → Dow tech components fall sharply US Dollar (DXY) Dollar correction → support for stocks and multinationals’ earnings Break above 102.50 (Walbaum’s trigger) → headwind for risk assets US midterms (Nov 3) A clear result removes uncertainty; Deutsche Bank expects midterm-year Q4 seasonality to help Disputed result or policy shock → volatility spike
What is the Dow Jones index and how does it work?
Dow Jones Price Prediction 2026–2030
The near-term path depends on the Fed, oil and earnings, but the long-term case rests on earnings growth and the Dow’s record of recovering from corrections. Published forecasts beyond 2027 are few, and most come from model sites rather than banks:
Year Range in Published Forecasts Key Forecast Source Primary Driver End-2026 50,500–55,250 Bank S&P 500 targets of 7,400–8,100 ≈ 50,500–55,250 on the Dow (median ≈ 54,600); Reuters poll median 54,500 (Aug 26); model sites 50,598–52,181 Q3 earnings, the Fed (Oct 28, Dec 9), oil and the Nov 3 midterms 2027 44,300–66,200 Bank S&P 500 targets of 8,300–8,800 ≈ 56,600–60,000 on the Dow; BofA 12-month 7,800 ≈ 53,200; Capital Economics’ 6,500 ≈ 44,300; LongForecast 66,214 (end-2027) EPS growth of about 16% expected for 2027 (FactSet); AI spending versus valuations 2028 60,000–70,000 Janus Henderson’s Buckley: 60,000–70,000 three-year target (Feb 2026); LongForecast 60,559 (end-2028) Earnings: Goldman sees S&P 500 EPS of $460 in 2028 2029–2030 60,000–73,000 Yardeni: Dow 60,000 by 2030 (2024 call); his S&P 500 10,000 target ≈ 68,200 on the Dow; LongForecast 67,688 (end-2029), 73,127 (Nov 2030) AI-driven productivity and earnings compounding
For the end of the decade, Ed Yardeni’s 2024 call for the Dow at about 60,000 by 2030 is still the best-known institutional target. He has since raised his end-of-decade S&P 500 target to 10,000, which would equal roughly 68,000 on the Dow (NAGA calculation). President Trump has said he expects the Dow at 100,000 “by the end of my Term,” a political statement rather than a forecast.
*It is worth keeping in mind that both analysts and online forecasting sites can and do get their predictions wrong. Keep in mind that past performance and forecasts are not reliable indicators of future returns. When considering Dow Jones price predictions for 2026 and beyond, it's important to keep in mind that high market volatility and macroeconomic environment make it difficult to produce accurate long-term Dow Jones analysis and estimates. As such, analysts and forecasters can get their Dow Jones forecast wrong.
It is essential to do your research and always remember your decision to trade depends on your attitude to risk, your expertise in the market, the spread of your investment portfolio, and how comfortable you feel about losing money. You should never invest money that you cannot afford to lose.
Is Dow Jones a good investment?
The Dow Jones was first published on May 26, 1896, at 40.94 points. It closed at 52,361.58 on October 26, 2026, about 1,280 times that starting level, and it has gained about 10% over the past 12 months.
Whether the Dow is the right investment for your portfolio depends on your investment horizon, risk tolerance and existing equity exposure. The near-term picture is nuanced: the Fed is still raising rates, oil swings with the Iran war, and the rally depends on a narrow group of AI stocks. A 15–20% correction from the August record would take the Dow back to roughly 43,500–46,200, around its March 2026 low: a meaningful loss from today’s level, but not a historical collapse.
The Dow's blue-chip composition provides structural resilience. Underperforming members are replaced by stronger companies — as the additions of Nvidia in 2024 and Alphabet in June 2026 illustrate. That resilience does not eliminate drawdown risk.
How to invest in Stock Indices
Read Also: Monthly Market Forecasts & Price Predictions
- Euro to Dollar forecast and price prediction 2026
- Pound to Dollar forecast and price prediction 2026
- USD to INR forecast 2026, 2027, 2030
- AED to INR forecast 2026, 2027, 2030
- SAR to INR forecast 2026, 2027, 2030
- Gold forecast and price prediction 2026
- Oil forecast and price prediction 2026
- Nasdaq-100 forecast and price prediction 2026
- Natural Gas forecast and price prediction 2026
- Silver forecast and price prediction 2026