



The Nasdaq 100 closed at 31,224.47 on October 6, 29,273.40 on October 26, up 15.9% this year and 6.25% below its record close of 31,224.47 on October 6. No bank publishes a Nasdaq 100 target, but the median of Wall Street’s year-end S&P 500 targets (8,000) equals about 30,500 on the Nasdaq 100 (NAGA calculation). The next tests come quickly: the Fed decision and Microsoft and Alphabet earnings on October 28, Amazon on October 29, Apple on November 2, the November 3 midterms, Nvidia in mid-November and the December 9 Fed decision, where futures priced about a 75% chance of another hike on October 26 (CME FedWatch).
The NASDAQ-100 tech index price reached a record near 30,660 in early June. After a summer correction of about 11% on rate-hike fears and a chip-stock sell-off, it set new records from late September and peaked at 31,224.47 on October 6.
The uptrend now faces a real test. The Federal Reserve raised rates on September 16 to 3.75–4.00%, its first hike since 2023, after the oil shock pushed inflation higher; consumer prices were still up 3.7% from a year earlier in September. Markets expect the Fed to hold on October 28, and a 75% chance of another hike on December 9 (CME FedWatch). The 10-year Treasury yield rose to around 5.3% in late September and October; higher yields weigh most on the long-duration growth stocks that dominate the Nasdaq 100.
On October 22 the index fell 2.9% after Meta raised the low end of its 2026 spending range to $135–145 billion, reviving doubts about the return on AI investment. Has the AI-driven rally run its course, or is this a pause within a broader bull market? “The AI narrative remains a major driver. If expectations around AI investment, earnings growth and productivity remain strong, technology stocks could continue to support the broader indices,” writes Frank Walbaum, Market Analyst at NAGA and a former hedge fund manager, in his Q4 2026 Market Outlook.
NASDAQ 100 Forecast 2026 — Summary
- NASDAQ-100 price prediction for year-end 2026: Bank targets for the S&P 500 imply the Nasdaq 100 finishing 2026 at about 28,200–30,900, with the median near 30,500 (NAGA calculation), just below the October record. The path depends on this week’s big-tech earnings, the Fed’s December decision and whether worries about AI spending ease.
- FORECASTERS’ BASE CASE, BANK-IMPLIED (28,200 – 30,900): If earnings keep growing, the Fed pauses or hikes only once more and AI spending keeps paying off for the biggest companies, the index could end the year near its October record. That is the range implied by banks’ year-end S&P 500 targets (NAGA calculation), with the median of 8,000 equal to about 30,500 in Nasdaq 100 terms.
- BULL CASE, ILLUSTRATIVE (31,300 – 33,000): Strong results from Microsoft, Alphabet, Amazon and Nvidia ease the worries about AI spending, inflation cools and the Fed skips the December hike. If the index breaks above its record, the next reference point on NAGA’s chart is the top of the rising channel, about 33,000 on October 27.
- BEAR CASE, ILLUSTRATIVE (23,000 – 26,500): Earnings or guidance disappoint, the Fed signals more hikes and yields climb back above their October high. “If the AI story begins to fade, however, the risk of a correction could rise quickly,” Walbaum warns. A weekly close below the 26,500 area would break the channel on NAGA’s chart; the next reference points are the March swing low near 22,900 and the February 2025 high at 22,267.
Note: These are illustrative scenarios only, not price targets or investment recommendations. Actual outcomes may differ materially.
- NASDAQ-100 price prediction 2027: Banks that publish 2027 or 12-month S&P 500 targets mostly see 8,300–8,800, about 31,650–33,560 on the Nasdaq 100 (NAGA calculation), with S&P 500 earnings expected to grow about 16% (FactSet). Bank of America (7,800 in 12 months) and Capital Economics (6,500 by the end of 2027) are the cautious exceptions. The key question for 2027 is whether the roughly $800 billion the largest tech companies are spending on AI this year starts to earn a return.
- Nasdaq-100 forecast for the next 5 years: Long-range calls are scarce and far apart. Ed Yardeni’s end-of-decade S&P 500 target of 10,000 equals about 38,100 on the Nasdaq 100 (NAGA calculation), and algorithmic models range from about 46,750 (WalletInvestor’s QQQ model, by October 2031) to about 62,850 (LongForecast, November 2030). The main structural risk is the one flagged a year ago: a “capex peak”, when AI infrastructure spending slows before revenue has caught up.
With NAGA, you can speculate on NASDAQ 100 (NAS100) price movements through CFDs or trade and invest in tech ETFs and stocks.
Nasdaq 100 Fundamental Analysis 2026
The Nasdaq 100’s 2026 story is a tug of war between two forces: an AI investment cycle that keeps growing, with the largest tech companies on track to spend about $800 billion this year, and a Fed that has switched from cutting rates to raising them. So far earnings have won: the index is up 15.9% this year despite two corrections.
The Fed’s First Hike Under Kevin Warsh — What It Means for Tech
The Fed held rates at 3.50–3.75% through the summer, including at Kevin Warsh’s first meeting as chair on June 17, when nine of 18 officials projected a hike and the statement dropped its easing bias. On September 16 it raised rates by 25 basis points to 3.75–4.00%, its first hike since 2023, and Warsh said: “The plain fact is that inflation is too high and has been for too long.” The trigger was inflation lifted by the oil shock from the Iran war: consumer prices rose 4.2% in the year to May and were still up 3.7% in September.
For the Nasdaq 100, the rate path matters more than for most indices, because its growth stocks are valued on profits far in the future. Markets expect a hold on October 28, but on October 26 futures priced about a 75% chance of a hike on December 9, even though September payrolls rose by just 29,000. Walbaum’s outlook frames the dilemma: weak data could make the Fed more cautious and support stocks, while strong data and rising yields would add pressure. A December pause could support the index’s long-duration names, while a hike with hawkish projections could weigh on them.
AI Capex and the AI Bubble Question
The AI investment cycle is still growing. The largest cloud and AI companies are on track to spend about $800 billion on capital expenditure in 2026, according to Goldman Sachs, which expects about $1.2 trillion in 2027. That spending feeds the index’s chipmakers directly: Micron reported record quarterly revenue of $54.23 billion on September 30, and Nvidia, Micron and AMD are now three of the Nasdaq 100’s seven largest weights.
The debate has shifted from AI demand to AI returns. Goldman Sachs estimates that the biggest spenders need about $300 billion a year in AI revenue to justify this investment. When Meta lifted the bottom of its 2026 capex range to $135–145 billion on October 21, its shares fell 7% the next day and the Nasdaq 100 dropped 2.9%. BCA Research’s Peter Berezin sums up the worry: “The core risk is financial and about timing, rather than AI failing technologically.” Fundstrat’s Tom Lee, by contrast, said on October 23 that the sell-off was “near the end stages.”
Regulatory Risk — Still a Wild Card, Not Yet a Crisis
Regulatory scrutiny of major cloud and AI platforms continues to intensify across both the US and the EU, with ongoing antitrust probes representing a persistent overhang. To date, the sector's historical pattern of navigating such pressure without major lasting damage to spending cycles has held, and demand for AI infrastructure has generally proven strong enough to outweigh enforcement-related drags. That said, a meaningfully tougher regulatory crackdown — particularly one targeting the mega-cap names most central to AI capex spending — remains a genuine tail risk that could compound the Fed-related valuation pressure already in play.
Understanding Capital Expenditures (CapEx)
The Magnificent 7 — A Year of Real Divergence
The Magnificent 7 (Nvidia, Apple, Microsoft, Amazon, Alphabet, Meta, Tesla) make up about 38.5% of the Nasdaq 100, based on the holdings of the Invesco QQQ ETF on October 23, and about a third of the S&P 500. In the first half of 2026 they lagged badly: a Bloomberg index of the seven fell 1.9% while the S&P 500 rose 9.3%. Their earnings are still growing fast: analysts polled by FactSet expect their third-quarter earnings to grow 33.2%, ahead of 27.7% for the rest of the S&P 500, before falling behind in the fourth quarter (23.6% vs 30.6%).
Performance within the group has diverged sharply. By mid-July, Microsoft was down about 20% for the year while Alphabet was up about 13% (Morningstar), and Tesla was still about 22% lower at the end of September. Meta’s 7% drop on October 22 showed how quickly sentiment can turn when investors question the payback on AI spending. The index itself is becoming less dependent on the seven: Micron, AMD and SpaceX, which joined on July 7, are now among its ten largest members.
NASDAQ 100 Technical Analysis
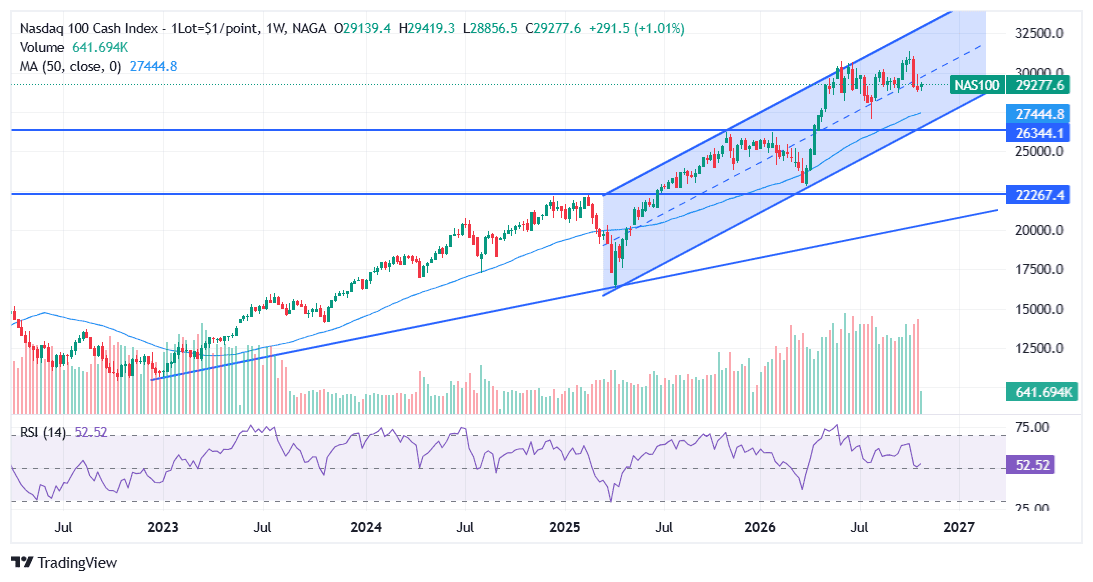
On weekly NAS100 chart, the Nasdaq 100 is still moving inside the rising channel that began at the April 2025 tariff-shock low near 16,300. The index was trading around 29,280, about 6% below its early-October record and just under the channel’s midline (about 29,750), with the rising 50-week moving average at 27,445 underneath.
The most telling part of the chart is the last leg up. From the March 2026 swing low near 22,900, the index climbed about 34% to the June high near 30,660 in about nine weeks, clearing the late-2025 high at 26,344 on the way. When the summer pullback came, it stopped near 27,000 in late July, well above that old high. That space between the latest swing low and the previous swing high is a sign of strong buying pressure: buyers stepped in long before the price got back to the old breakout level. That pressure is no longer visible. Since June the index has moved sideways between roughly 27,000 and 31,300, the October push to a new record did not extend, and the weekly RSI has eased from around 75 in early summer to 52. Momentum is weaker, but nothing on the chart shows a change in market conditions yet.
Past performance is not a reliable indicator of future results. All historical data, including but not limited to returns, volatility, and other performance metrics, should not be construed as a guarantee of future performance.
Where the Trend Would Change: The 26,500 Area
The level that matters is the 26,500 area, where the channel’s lower line (about 26,550 on October 27 and rising) meets the late-2025 high at 26,344. That old high turned into support in the summer, and the channel floor has held every test since April 2025. A weekly close below this zone would break both the channel and the pattern of higher lows, and would be the first sign that the uptrend is changing. Until then, a pullback toward the summer low near 27,000 or the 50-week average would not by itself change that picture.
Above the market, the early-October record near 31,300 is the first reference point, and the channel top, around 33,000, marks the upper boundary. Below the 26,500 area, the next references are the March 2026 swing low near 22,900 and the February 2025 high at 22,267, and then the long-term trendline from the 2022 lows, near 20,300. These are reference points for reading the chart, not price forecasts.
Key Technical Levels
LEVEL POINTS (OCT 27, 2026) SIGNIFICANCE Channel Top (rising) ~33,000 Upper line of the channel from the April 2025 low; a chart reference point 2026 Record High ~31,300 Early-October 2026 peak; the June high was ~30,660 50-Week Moving Average ~27,445 Rising; the summer pullback low (~27,050) held just below it 26,500 Area 26,344 – 26,550 Channel floor plus the late-2025 high; a weekly close below would signal a change in trend March 2026 Swing Low ~22,900 Start of the strongest leg of the rally; held above the February 2025 high (22,267) Long-Term Trendline ~20,300 Rising line from the 2022 lows; the deepest reference on the weekly chart Past performance is not a reliable indicator of future results. Technical levels are analytical reference points, not price forecasts.
To learn more about technical analysis as a forecasting tool, visit NAGA Academy.
NASDAQ 100 Forecast 2026 — Wall Street’s Year-End Targets
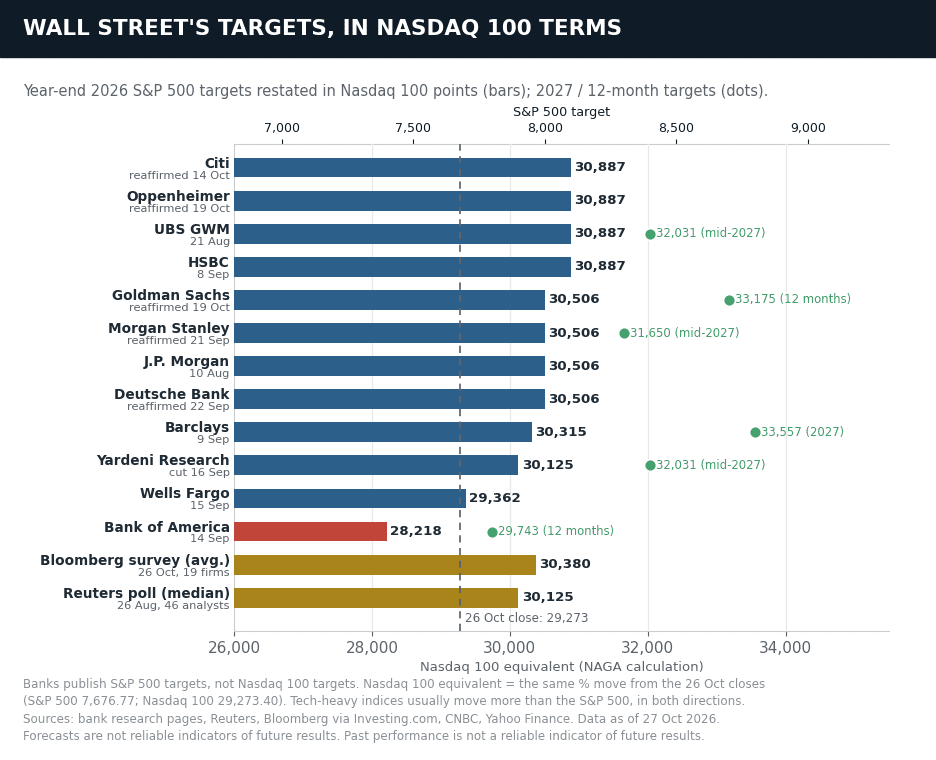
No major bank publishes a target for the Nasdaq 100 itself. Banks set year-end targets for the S&P 500, so the table shows those targets as published, with the date of the latest call, and the level the Nasdaq 100 would reach if it moved by the same percentage. Because the Nasdaq 100 is far more concentrated in technology, it has tended to move further than the S&P 500 in both directions, so read the equivalents as a rough guide rather than a forecast.
INSTITUTION YEAR-END 2026 S&P 500 TARGET NASDAQ 100 EQUIVALENT* KEY DRIVERS Citi 8,100 (reaffirmed Oct 14) ~30,890 Needs the rate-sensitive half of the market to recover, which requires lower long-term yields Oppenheimer 8,100 (reaffirmed Oct 19) ~30,890 Raised its 2026 earnings-per-share estimate to $365 UBS Global Wealth Management 8,100 (Aug 21); 8,400 by mid-2027 ~30,890 Earnings beats broadening beyond tech; AI demand HSBC 8,100 (Sep 8) ~30,890 $360 EPS at 22.5x; turned tactically neutral on Oct 26 but stays bullish for 2027 Goldman Sachs 8,000 (reaffirmed Oct 19); 8,700 in 12 months ~30,510 Earnings growth to slow but not collapse; AI capex near $800bn in 2026 Morgan Stanley 8,000 (reaffirmed Sep 21); 8,300 by mid-2027 ~30,510 Flagged a dip toward 7,100 first (Oct 2); Mike Wilson said on Oct 20 the correction was in its “final innings” J.P. Morgan 8,000 (raised Aug 10) ~30,510 Broad earnings growth and evidence that AI spending is being monetized Deutsche Bank 8,000 (reaffirmed Sep 22) ~30,510 Raised its 2027 EPS estimate to $420 Barclays 7,950 (Sep 9); 8,800 for 2027 ~30,320 Raised from 7,800 on stronger earnings Yardeni Research 7,900 (cut Sep 16); 8,400 by mid-2027 ~30,130 Higher bond yields, a lower year-end P/E (18.6 from 19.8) and stagflation risk Wells Fargo Securities 7,700 (cut Sep 15) ~29,360 Late-cycle market; lower valuations as yields rise Bank of America 7,400 (Sep 14); 7,800 in 12 months ~28,220 Street low: an overdue pullback and inflation above what valuations price in Bloomberg survey (19 forecasters) 7,967 average (Oct 26) ~30,380 Down from 7,976 in September Reuters poll (46 analysts) 7,900 median (Aug 26) ~30,130 Up from 7,620 in the May poll
*NAGA calculation: the same percentage move as the S&P 500 target, applied to the Nasdaq 100 close of 29,273.40 on October 26 (S&P 500: 7,676.77). The median target, 8,000, equals about 30,500 on the Nasdaq 100, just over 2% below the record close of 31,224.47 set on October 6. Targets move with the market: J.P. Morgan has changed its target four times this year, and Yardeni cut his in September, so treat them as a guide to sentiment rather than point estimates.
Nasdaq 100 Forecast 2027: What Wall Street Expects Next
Banks that have published 2027 or 12-month S&P 500 targets mostly see 8,300–8,800, which would put the Nasdaq 100 at about 31,650–33,560 on the same percentage move (NAGA calculation). Morgan Stanley targets 8,300 by mid-2027, and its chief US equity strategist Mike Wilson said on October 20 that 8,500 “could be achievable” by then. UBS Global Wealth Management and Yardeni Research see 8,400 by mid-2027, Goldman Sachs 8,700 in 12 months and Barclays 8,800 for 2027. Analysts polled by FactSet expect S&P 500 earnings to grow about 16% in 2027, after about 33% in 2026.
Not everyone is that optimistic. Bank of America’s 12-month target of 7,800 equals about 29,740 on the Nasdaq 100. Capital Economics expects the S&P 500 to reach 8,250 by the end of 2026 and then fall to 6,500 by the end of 2027, about 24,790 in Nasdaq 100 terms; its senior markets economist James Reilly said the data “look consistent with a late-stage bubble.” BCA Research’s Peter Berezin calls the bull market “mature rather than over” and sees the bigger risk for the Nasdaq in 2028.
Magnificent 7 Stocks Forecast & Analyst Price Target
Because the Magnificent 7 carry so much weight in the Nasdaq 100, their analyst price targets are a useful cross-check on the index forecasts. The chart shows the average, lowest and highest 12-month analyst targets for each stock against its closing price on October 26, 2026.
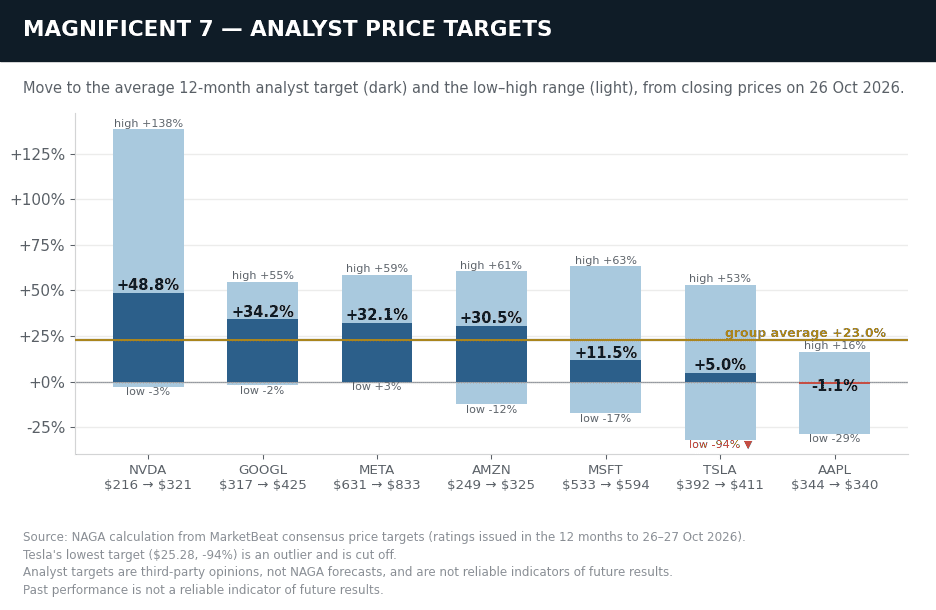
Nvidia has the most upside to its average analyst target (+48.8%). By contrast, Microsoft shows only +11.5%, while Meta (+32.1%) and Amazon (+30.5%) sit above the group average; even Meta’s lowest target is above its share price after the post-earnings drop. Alphabet (+34.2%) has the second-highest upside, while Apple (−1.1%) now trades slightly above its average target, and Tesla (+5.0%) has the widest spread of views, with targets from about $25 to $600.
Averaged across the seven stocks, the implied upside to the consensus targets is about 23% (October 26 closes), down from roughly 29% when this article was last updated in June. Walbaum’s outlook notes that a relatively small group of companies has driven much of the index’s gains while many other stocks have struggled to participate, which is why these seven names matter so much for where the Nasdaq 100 goes next.
AI-Based NASDAQ 100 Forecasts — What the Algorithms Say
Algorithmic forecasting sites update their projections automatically from price history and macro data. As of October 27, 2026, they disagree about the next few months, but most still point higher over longer horizons.
MODEL END-2026 TARGET 12 MONTHS / LONGER TERM NOTES WalletInvestor (QQQ ETF model) +10.2% by December 2026 (about 32,250 in Nasdaq 100 terms) +14.9% in 12 months; +59.7% in five years (about 46,750) No Nasdaq 100 index page; QQQ tracks the index (equivalents are a NAGA calculation) Trading Economics 28,344 at the end of Q4 26,579 in 12 months Macro-model projection; the most cautious of the three LongForecast 28,900 (December range 26,877–30,923) 41,475 at the end of 2027; about 62,850 by November 2030 Updated October 27; the model path dips into early 2027 before rising
The spread between these models is wide. Over the next few months they range from a small dip to a gain of about 10%, and over longer horizons from a fall of about 9% in 12 months (Trading Economics) to a rise of more than 40% by the end of 2027 (LongForecast).
That spread is a reminder of why algorithmic and scenario-based models, however well-constructed, tend to be better at framing the range of plausible outcomes than at predicting which one — or whether some combination — actually plays out.
Forecasts are based on algorithmic and AI models using historical data and assumptions. They are uncertain and may not reflect future market conditions. This content is for informational purposes only and is not investment advice. Past performance is not indicative of future results.
NASDAQ 100 Price History — Key Moments
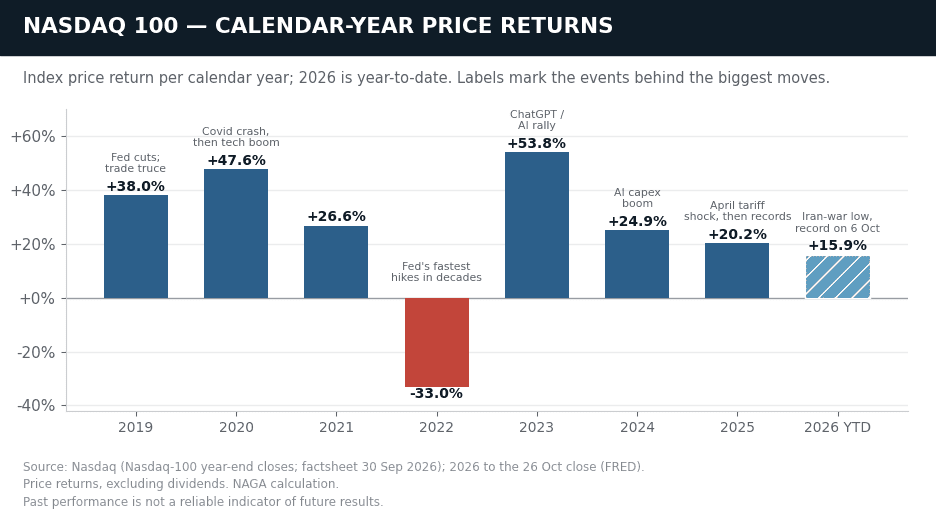
The Nasdaq 100’s recent history is a story of sharp drops inside a powerful uptrend. Since its 2022 bear-market low, the index has nearly tripled, despite two corrections of more than 10% in 2026 alone.
October 2022: The Bear Market Low
The Nasdaq 100 hit its bear-market low of 10,440.64 (intraday) on October 13, 2022, after falling about 38% from its November 2021 intraday record of 16,764.86, as the Fed’s fastest rate hikes in decades crushed valuations for growth and technology stocks. The index ended 2022 down 33%. That low marks the start of the current bull market.
2023–2024: The AI Rally Begins
The recovery began in 2023 as excitement about generative AI took hold after the launch of ChatGPT in late 2022, and the index gained 54% that year. The rally broadened in 2024 as the largest tech companies committed to massive AI infrastructure spending: the index first closed above 20,000 in July 2024 and finished the year up 25%.
2025: A 20% Gain Despite the Tariff Shock
The index gained 20.2% in 2025 and closed the year at 25,249.85, despite a drop of more than 20% between February and April after President Trump announced sweeping tariffs on “Liberation Day”, April 2, 2025. AI enthusiasm and strong earnings then drove a new run of records through the rest of the year.
March 2026: The Iran-War Sell-Off
The US–Israel strikes on Iran on February 28 disrupted shipping through the Strait of Hormuz and sent oil soaring. The Nasdaq 100 closed in correction territory on March 27 and hit its 2026 closing low of about 22,953 on March 30, the day US crude settled above $100 for the first time since 2022, as rising bond yields and worries about AI spending added to the pressure.
April–October 2026: From V-Shaped Rebound to New Records
From the March low, the index staged an extraordinary recovery. A ceasefire on April 8 and a strong earnings season lifted it 15.6% in April, its best month since 2002. It closed above 30,000 for the first time on May 26 and reached a record near 30,660 in early June, about 34% above the March low in nine weeks. Rate-hike fears and a chip-stock sell-off then drove a correction of about 11% into late July. The index recovered to new records from September 22 and peaked at a record close of 31,224.47 on October 6, before worries about AI spending pulled it back about 7% by October 23.
It is worth keeping in mind that both analysts and online forecasting sites can and do get their predictions wrong. Keep in mind that past performance and forecasts are not reliable indicators of future returns. When considering Nasdaq 100 price predictions for 2026 and beyond, it’s important to keep in mind that high market volatility and the macroeconomic environment make it difficult to produce accurate long-term Nasdaq 100 analyses and estimates. As such, analysts and forecasters can get their Nasdaq 100 forecast wrong.
It is essential to do your research and always remember that your decision to trade depends on your attitude to risk, your expertise in the market, the spread of your investment portfolio, and how comfortable you feel about losing money. You should never invest money that you cannot afford to lose.
Sources:
- Federal Reserve — FOMC Press Release, September 16, 2026
- FRED / St. Louis Fed — NASDAQ-100 Historical Data
- CNBC — NASDAQ 100 Futures Quote & News
- NPR — Federal Reserve Coverage
- CME Group — E-mini NASDAQ-100 Futures Overview
- Nasdaq, Inc. — NASDAQ-100 (NDX) Official Data
- Nasdaq Global Indexes — Nasdaq-100 Index Factsheet
- FactSet Insight — Magnificent 7 and S&P 500 Earnings Growth, Q3 2026
Other Resources:
- Dow Jones forecast & price predictions 2026
- DAX 40 forecast & price predictions 2026
- EUR/USD forecast & price predictions 2026
- Oil forecast & price predictions 2026
- Gold forecast & price predictions 2026
- Silver forecast & price predictions 2026
- Natural Gas forecast & price predictions 2026
- IBEX 35 forecast & price predictions 2026
- Understanding Capital Expenditures (CapEx)
- How to trade stocks and indices