


Updated October 26, 2026. Silver remains under pressure. It fell to around $53 on October 23, its lowest since November 2025, after a hotter-than-expected US inflation report revived Fed rate-hike bets and oil prices hit a five-month high. Bank forecasts published since July put silver between $63 and $75 for the rest of 2026. A pause in Fed hikes, a weaker dollar or a US–Iran deal to reopen the Strait of Hormuz could trigger a rebound.
Few assets in 2026 have moved as violently as silver. The metal carried 2025's extraordinary rally of more than 140% into the new year, surging from a 2025 close of $71.65 through $90 on January 14 to an all-time high of $121.64 per ounce on January 29, 2026 — driven by safe-haven demand, softening US inflation data, and expectations of Federal Reserve rate cuts.
That rally reversed sharply when President Trump nominated Kevin Warsh, a noted inflation hawk, as the next Federal Reserve Chair on January 30 — the shock triggered an immediate repricing of the entire rate-cut narrative that had underpinned silver's rise, and silver fell from above $118 to below $77 within that session, hitting an intraday low near $64 on February 6 — 47% below the peak.
The recovery that followed never took hold. Silver rallied to $76.70 on the April 8 US–Iran ceasefire and back above $70 in mid-June, but fell below $60 for the first time since December 2025 on June 24 and hit $54.77 on July 17 as solar demand weakened and banks slashed their forecasts. An August rebound faded after the Fed raised rates on September 16, and on September 28 silver fell about 5% after President Trump rejected Iran’s proposal to reopen the Strait of Hormuz over the weekend. In October the sell-off resumed: silver fell about 6% on October 14 after a hotter-than-expected US inflation report and broke below its July low on October 22, reaching around $53 the next day, its lowest level since November 2025.
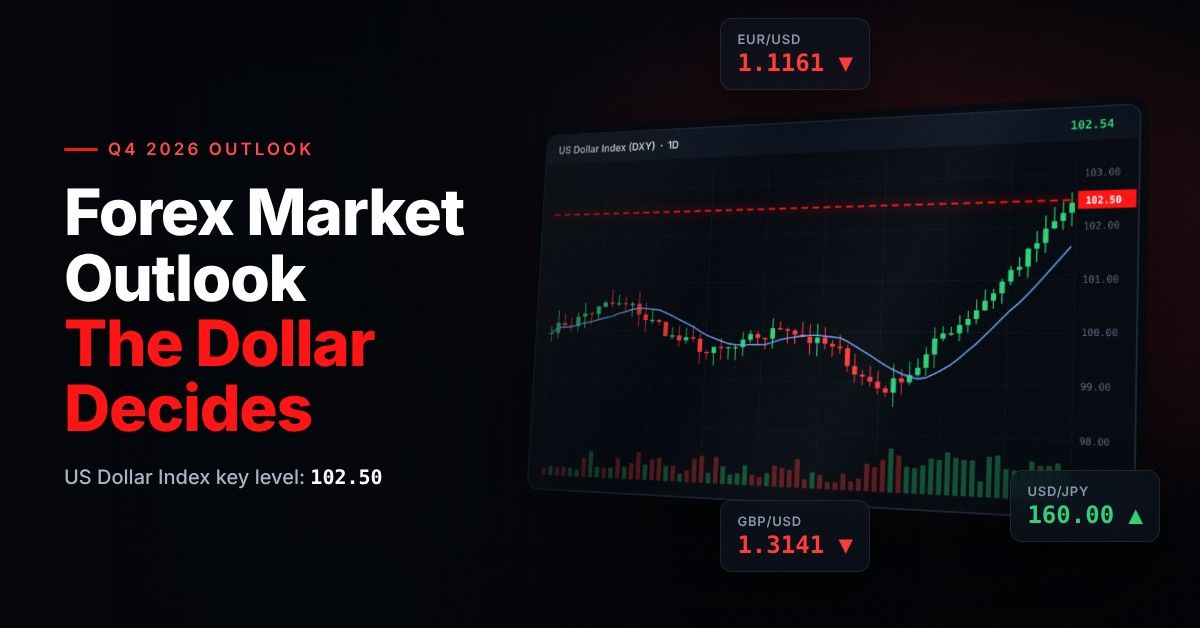
“Silver should broadly follow the direction of gold, but with greater volatility,” says Frank Walbaum, Market Analyst at NAGA and a former hedge fund manager, in his Q4 2026 Market Outlook. He notes that silver benefits from a supportive precious-metals environment but is more sensitive than gold to industrial demand and overall risk appetite. The US dollar is the other swing factor: a sustained break above 102.50 on the US dollar index — a level it touched on October 5 — would keep pressure on both metals, while a dollar correction on weaker US data would support them.
With such extraordinary volatility behind it, institutional silver forecasts have been cut hard since May — J.P. Morgan now sees a fourth-quarter average of $63 — yet LBMA conference delegates still expect $94.70 within 12 months. Will XAG/USD go back up toward $100, or fall further first? Here is the full picture.
Silver Forecast & Price Prediction – Summary
- Silver price forecast Q4 2026: After breaking below its July low in late October, silver’s path depends on the Fed’s December decision, the US dollar and whether the US and Iran agree to reopen the Strait of Hormuz. A sixth straight supply deficit still supports prices, but it is smaller than expected and no longer prevents deep pullbacks.
- BASE CASE ($54 – $70): The Fed hikes once more in December and then pauses, the dollar stops rising, and silver stabilises above $50 before recovering part of its October losses toward the latest calls from J.P. Morgan ($63 Q4 average), Commerzbank ($67 at year-end), BMO ($67.40 Q4 average) and UBS ($70 in December). Weak solar demand caps rallies.
- BULL CASE (illustrative, $70 – $80): Weaker US data trigger a correction in the stretched dollar, December hike bets fade and a US–Iran deal lowers oil prices. Silver climbs back above its 50-day and 50-week moving averages (about $61.90 and $69.80 on October 26) and heads for Citi’s 0–3-month target of $75; Metals Focus’s Philip Newman has said silver could reach $80 before year-end. LBMA conference delegates, the most bullish group, see $94.70 within 12 months.
- BEAR CASE (illustrative, $43 – $54): The Fed signals more hikes, US 10-year yields stay above 5% and the US dollar index breaks sustainably above 102.50 — the trigger Walbaum’s Q4 outlook flags for renewed dollar strength — or the late-October equity sell-off deepens and hits industrial-demand expectations. Silver loses $50 and tests the $43–46 area, where the late-October 2025 low and the long-term trendline from early 2024 meet. Bloomberg Intelligence’s Mike McGlone sees around $50 as the first good support, and UBS sees $48–$50 as a buy-the-dip zone.
- Silver price prediction 2027: J.P. Morgan now expects silver to average $63.90 in 2027, rising only to $65 by the fourth quarter, as solar thrifting loosens the market and the gold-silver ratio averages about 75. Others are more constructive: UBS sees $75 by mid-2027 and $80 by September 2027, and Commerzbank $80 by the end of 2027. The Silver Institute still expects a deficit in 2026 — the sixth in a row — but a far smaller one than in 2021–2024.
- Silver price prediction for the next 5 years: Longer-term silver bulls point to the gold-silver ratio's historical mean-reversion tendency: with the ratio back near 70, a return toward the low 60s would let silver outperform gold even without new catalysts. Structural demand drivers — solar panel manufacturing (one UNSW study’s business-as-usual scenario had solar absorbing 85–98% of known silver reserves by 2050, before the current wave of thrifting), EV electrification, and AI data centre buildouts — all point toward demand growth through the decade. The countervailing risk is substitution: high prices have already pushed solar makers to use less silver, and the Silver Institute expects solar silver demand to fall about 19% in 2026. For the long run, BMO raised its long-term price assumption to $47 from $36 in September, while HSBC’s May forecasts ease to $52 by 2029.
With NAGA.com, you can trade Silver through CFDs (XAG/USD) if you want to speculate on price movements or invest in silver mining stocks and ETFs.
Silver Fundamental Analysis 2026
Silver’s 2026 story is a tug-of-war between a hawkish Federal Reserve and a supply deficit, now forecast for a sixth straight year, that is narrowing as high prices destroy demand. Understanding both forces — and how they interact — is essential to making sense of the metal’s extreme volatility.
The Warsh Shock — From Fed Nomination to First Rate Hike
On January 30, 2026, President Trump nominated Kevin Warsh — a former Fed governor known for hawkish inflation views and criticism of post-pandemic monetary expansion — to succeed Jerome Powell as Federal Reserve Chair. The market reaction was immediate and severe: gold tumbled from the record it had set the day before, and silver, trading at even higher beta to rate expectations, fell from above $118 to below $77 in a single session and was 47% below its $121.64 peak at the February 6 intraday low.
The move reflected a wholesale repricing of the rate-cut path that had driven silver's January surge — investors had been pricing aggressive Fed easing through 2026, and Warsh's nomination signalled a far more cautious, "sound money" approach to monetary policy. Warsh succeeded Jerome Powell in May, and the Fed kept rates at 3.50–3.75% through the summer. Then policy turned more hawkish. On September 16 the Fed raised rates for the first time since 2023, by 25 basis points to 3.75–4.00%, and minutes released on October 7 showed all 19 policymakers backed the move, with a majority seeing another hike as likely appropriate. Markets now price a December hike at around 80%. As J.P. Morgan puts it, “Higher Fed rates increase the opportunity cost of holding non-yielding assets like silver.”
Why Is Silver Going Down? Yields, the Dollar and Iran
Three forces have pushed silver lower since the summer. The first is yields: US 10-year Treasury yields rose above 5% in September and reached about 5.34% on October 1, the highest since 2002, raising the cost of holding a metal that pays no interest. “When long yields rise, silver falls, whatever the Treasury does to stop them,” says Przemyslaw Radomski of Sunshine Profits. A hotter-than-expected US inflation report on October 14 (3.7% in September) pushed yields back toward 5.3% and sent silver down about 6% that day. The second is the US dollar, which hit an 18-month high of 102.53 on the US dollar index on October 5. The third is weaker industrial demand, especially from solar panel makers (see below).
Geopolitics has not helped either. The US–Iran war, which began on February 28, has kept oil prices and inflation fears high, and each ceasefire rally in silver — 5% on April 8, 4% on June 15 — faded as talks stalled. When President Trump rejected Iran’s proposal to reopen the Strait of Hormuz, silver fell about 5% on September 28, more than gold. Walbaum’s Q4 outlook explains the pattern: in a sharp risk-off move, investors may initially reduce positions across asset classes — gold included — before safe-haven demand returns, and silver, with its industrial exposure, could see a more pronounced correction. That is what happened in late October: Houthi attacks on Saudi Arabia lifted Brent crude above $115, its highest in five months, and a sell-off in technology stocks spilled over into metals — what Justin Lin of Global X ETFs called a “liquidity-driven selloff.”
Will Silver Go Back Up? What Would Trigger a Rebound
A rebound needs at least one of three things: a pullback in the US dollar from its 18-month high, a pause in Fed rate hikes, or a US–Iran deal that lowers oil prices and inflation fears. Equity markets matter too. Walbaum notes that silver could maintain its bullish momentum if stocks continue higher, but warns: “If stocks weaken significantly, however, demand expectations could fade and silver could experience a more pronounced correction than gold.”
Signs of a floor are harder to find since silver broke below its July low on October 22, but several analysts see buyers waiting lower. Bloomberg Intelligence’s Mike McGlone, who expects silver’s post-bubble “hangover” to last, said on October 13 that “around $50 is the first good support,” and UBS sees $48–$50 as a buy-the-dip zone. Investment demand for coins and bars is forecast to rise 18% this year (Silver Institute). Most banks expect a modest recovery rather than a new rally — their forecasts for the rest of 2026 range from $63 to $75 — while LBMA conference delegates see $94.70 within 12 months.
Sixth Straight Year of Supply Deficit — But a Smaller One
Beneath the headline volatility, silver’s structural story is intact, but less dramatic than it was. The Silver Institute expects a sixth consecutive market deficit in 2026 of 46.3 million ounces, after 40.3 million in 2025; in February it had forecast 67 million. Cumulative shortfalls since 2021 total about 762 million ounces — close to a full year of global mine output (846.6 million ounces in 2025) — drawn from above-ground stocks.
About 72% of mined silver comes as a by-product of lead, zinc, copper or gold mining (primary silver mines supply only 28%), meaning higher prices cannot quickly translate into new supply — developing a new primary silver mine typically takes a decade from discovery to production. That tightness peaked in October 2025, when London lease rates spiked above 30%. It has since eased: “Lease rates in London have largely normalised, but risks of another liquidity squeeze this year remain,” Metals Focus’s Philip Newman said in April, London vault holdings rose to 28,431 tonnes by the end of August, and Deutsche Bank now expects more metal to become available.
AI, Solar and Data Centres — Where Silver Demand Is Shifting
Silver’s industrial demand is changing shape. Industrial use is forecast to fall 3% in 2026 to a four-year low of about 640 million ounces, even as newer uses grow. “AI and data centers are emerging as important sources of demand that weren’t on the map a few years ago,” says Michael DiRienzo of the Silver Institute, alongside electric vehicles and grid electrification. No reliable figure yet exists for how much silver AI hardware uses, however.
Solar, silver’s largest industrial use, is moving the other way. High prices have accelerated thrifting and substitution: the Silver Institute expects silver demand from solar panels to fall about 19% in 2026, J.P. Morgan sees a drop of around 30%, and Deutsche Bank says Chinese solar demand for silver is down by a third. “The high price environment has actually catalyzed really fast-paced demand destruction,” says Deutsche Bank’s Daniel Ghali. Over the long run, solar remains a major consumer — one UNSW study’s business-as-usual scenario had it absorbing 85–98% of known silver reserves by 2050 — but that projection predates the current wave of thrifting.
Gold-Silver Ratio — A Key Relative-Value Signal
The gold-silver ratio — how many ounces of silver it takes to buy one ounce of gold — is a closely watched signal of silver's relative strength. The ratio swung dramatically over the past 18 months: from above 80 for most of 2024–2025, it compressed sharply to below 50 in late January 2026, for the first time since 2012, as silver's rally outpaced even gold's own strong run, before widening back out to nearly 73 in early February.
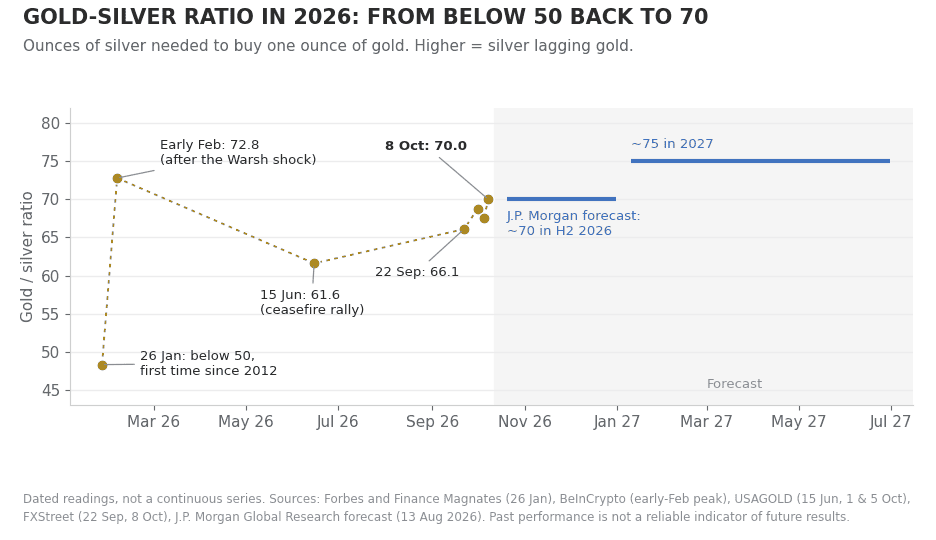
By early October the ratio had widened back to about 70 — a sign that silver has lagged gold in the sell-off, as it usually does when risk appetite fades. J.P. Morgan expects the ratio to average about 70 in the second half of 2026 and about 75 in 2027, while UBS sees limited room above 70. For silver bulls, a move back toward 60 or below would be the clearest sign that silver is outperforming again.
How to Trade and Invest in Silver
Technical Silver Price Forecast 2026
Technically, silver's 2026 chart is dominated by the extreme January spike-and-reversal pattern. The rally to $121.64 on January 29 capped an unprecedented breakout above every prior resistance level, but the speed of the subsequent Warsh-driven reversal — about 47% in just over a week — left the move looking unsustainable even to many silver bulls. Since then, every rebound has topped out well below the January peak — at $76.70 in April, about $71 in June and August, and $67.55 in September — and on October 22 silver broke below its July low. The weekly and daily charts below show the long- and medium-term levels that matter now.
XAG/USD Weekly Chart Analysis
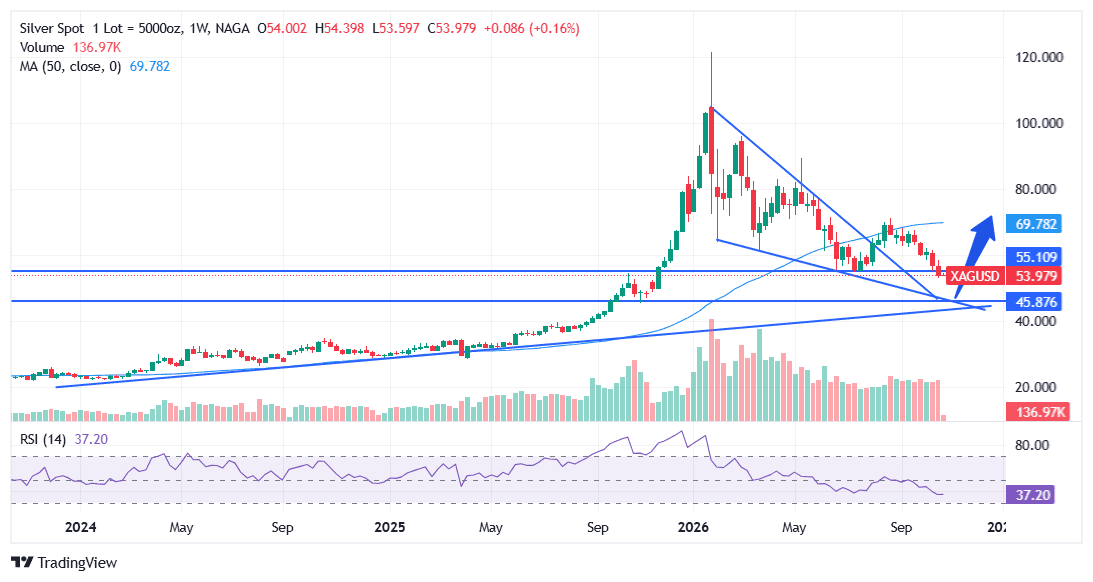
On the weekly chart, the decline from the January record has formed a falling wedge. Its upper line runs from the late-January highs through the lower highs of March and May; its lower line starts at the February low near $64. Silver broke above the upper line in early August, but the rebound stalled near $71 and the October sell-off took the price back below $55.11. That level, close to the October 2025 record and to the June–August 2026 lows, now acts as resistance. The two wedge lines meet at about $46–47, just above horizontal support at $45.88 (near the late-October 2025 low), while the rising trendline from the early-2024 lows sits at about $43–44.
Past performance is not a reliable indicator of future results. All historical data, including but not limited to returns, volatility, and other performance metrics, should not be construed as a guarantee of future performance.
For the long-term trend, the $43–47 zone is the key reference area. A retest that holds there would keep the wedge breakout and the uptrend from early 2024 intact, with $55.11 and then the 50-week moving average ($69.78 on October 26) as the levels a recovery would need to reclaim. Weekly closes below the long-term trendline, around $43, would break that uptrend and turn the 2026 decline into a deeper correction of the whole 2024–2026 rally. Weekly RSI is 37: weak, but not yet oversold.
Between the current price and that zone, $50 is the main round-number reference; UBS said in July that it sees $48–$50 as a buy-the-dip zone. On the upside, weekly closes back above $55.11 would be the first sign that the October breakdown has failed.
XAG/USD Daily Chart Analysis
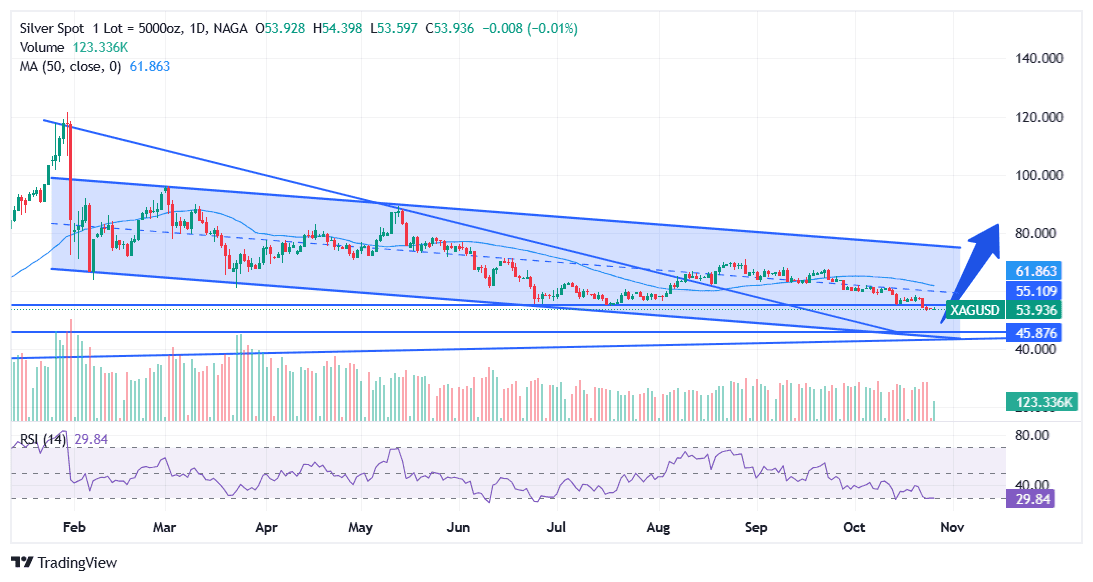
The daily chart shows the medium-term picture. Since February, silver has traded in a descending channel; on October 26 its upper line was near $75, its midline near $60 and its lower line near $44, all three falling by roughly $2.50 a month. The 50-day moving average ($61.86) has turned lower and sits just above the midline, making $60–62 the main medium-term resistance above $55.11. A steeper trendline from the January record falls through the $45.88 support and meets the channel floor near $44–45.
Past performance is not a reliable indicator of future results. All historical data, including but not limited to returns, volatility, and other performance metrics, should not be construed as a guarantee of future performance.
Momentum is stretched: the daily RSI slipped below 30 on October 26, into oversold territory, after the October 22–23 sell-off. Oversold readings can persist in a downtrend, so on this timeframe the first sign of stabilisation would be daily closes back above $55.11. Until then, the $43–46 area, where the channel floor, the January trendline, the long-term rising trendline and the $45.88 support converge, is the medium-term reference zone. A recovery from there would bring the channel midline and 50-day average ($60–62) and then the channel top (around $75) back into view; daily closes below the channel floor (about $44 on October 26 and falling by roughly $2.50 a month) would break the channel to the downside.
Key Technical Levels
LEVEL PRICE SIGNIFICANCE 2026 All-Time High $121.64 January 29 intraday record; no major bank forecast expects a retest in 2026 Resistance Zone $60–$75 Daily channel midline and 50-day average ($60–$61.86), 50-week average ($69.78) and the top of the daily channel (~$75), October 26 readings ⬤ Current Zone $53–$55.11 Former support at $55.11, near the October 2025 record and the June–August 2026 lows, broken on October 22; silver fell to about $53 on October 23 (see the live price above) Round-Number Support $50.00 Bloomberg Intelligence’s Mike McGlone sees around $50 as the first good support; UBS sees $48–$50 as a buy-the-dip zone Horizontal Support $45.88 Near the late-October 2025 low; the weekly wedge lines meet just above, at $46–47 Long-Term Trendline $43–$44 Rising trendline from the early-2024 lows and the floor of the daily channel; weekly closes below would break the 2024–2026 uptrend Past performance is not a reliable indicator of future results. Technical levels are analytical reference points, not price forecasts.
To learn more about technical analysis as a forecasting tool, visit NAGA Academy.
Silver Price Predictions 2026–2027 — Institution Forecasts
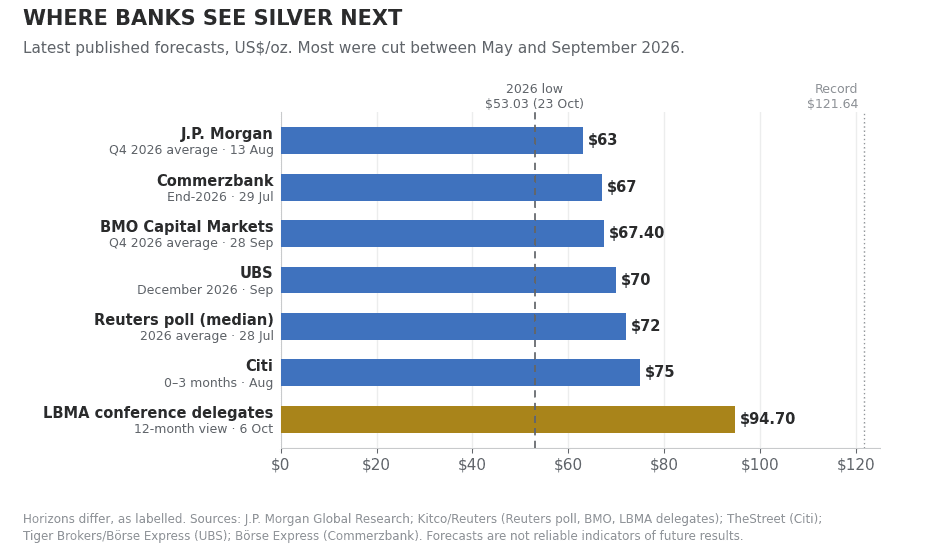
Banks cut their silver forecasts hard between May and September as solar demand weakened and the Fed turned hawkish. Here is where the leading voices stand, as of October 8, 2026:
INSTITUTION 2026 FORECAST 2027 BIAS KEY NOTES J.P. Morgan $70.6/oz avg; $63 Q4 $63.9/oz avg Cautious Cut on August 13 from $84.3 avg / $90 Q4; sees solar silver demand ~30% lower in 2026 Bank of America $85.93 avg (May) — Bullish (dated) No update since May; Widmer: above $100 in Q4 only if gold rallies first. The $135–$309 range was a historical ratio comment, not a forecast Reuters Analyst Poll $72 (median, July) — Neutral consensus Down from $78 (April) and $79.50 (January); 29 analysts; next poll due late October Commerzbank $67 (end-2026) $80 (end-2027) Cautious Cut from $80 on a restrictive Fed, strong dollar and higher oil; sees “fair” value near $57.50 BMO Capital Markets $67.40 Q4 avg $69.30 (Q1 2027) Cautious “In silver, faster-than-expected thrifting and slower solar deployment are loosening industrial market balances”; long-term price $47 UBS $70 (December) $75 (H1), $80 (Sep 2027) Constructive Sees silver as “high-beta” gold; buy-the-dip zone $48–$50 Citi $75 (0–3 months) $90 (6–12 months) Bullish Expects Hormuz de-escalation and a less hawkish Fed; investment demand offsets solar thrifting LBMA conference delegates $94.70 (12-month view) — Most bullish Poll at the LBMA/LPPM precious metals conference, October 6, 2026; silver was $61.23 at the time Forecasts reflect each institution’s most recently published figures as of October 8, 2026, and may be revised again after the Fed’s December decision and any progress in US–Iran talks over the Strait of Hormuz. The spread between forecasts (from $63 to $94.70) reflects genuine uncertainty in this market — read all targets with appropriate caution. Past performance is not a reliable indicator of future results.
J.P. Morgan — $70.6/oz Average, $63 in Q4
J.P. Morgan Global Research cut its silver forecasts on August 13. It now expects silver to average $70.60/oz in 2026, with the third quarter at $62.50 and the fourth at $63, down from $84.30, $85 and $90 in May. The main reason is solar: “we see the potential for solar demand for silver to fall by around 30% this year,” wrote analyst Gregory Shearer, as panel makers thrift and Chinese buyers stocked up early ahead of an export-rebate change. The physical squeeze that fuelled the January spike has also unwound.
For 2027, J.P. Morgan expects an average of $63.90/oz, rising only to $65 by the fourth quarter, with the gold-silver ratio averaging about 75 — in other words, no return to the highs. Note that headlines claiming J.P. Morgan expects silver to crash to $50 refer to a social-media post by Marko Kolanovic, who left the bank in 2024 and predicted a drop of about 50%; it is not a J.P. Morgan forecast.
Bank of America and the LBMA Poll — The Bullish Camp
Bank of America’s last published silver forecast, from May 1, is a 2026 average of $85.93/oz. The much-quoted $135–$309 range was never a price target: in January, Kitco reported BofA’s head of metals research Michael Widmer as saying “history suggests silver prices could peak between $135 and $309,” based on past gold-silver ratio lows, without a time frame. In late May, Widmer said silver could top $100 in the fourth quarter only if gold rallied first, and not for long.
Today, the most bullish view comes from the market itself: delegates at the LBMA/LPPM precious metals conference in early October forecast silver at $94.70 an ounce within 12 months, more than 50% above the $61.23 spot price at the time. Citi is also constructive, with a 6–12-month target of $90, and Metals Focus’s Philip Newman said in August that silver could reach $80 before year-end.
AI-Based Silver Forecasts — What the Algorithms Say
Alongside traditional bank research, a growing number of algorithmic and AI-driven forecasting platforms publish their own silver price models, typically blending historical price patterns, technical indicators, and market sentiment data. These models have produced some of the widest and most actively updated forecasts in the current cycle and are worth reading alongside — not instead of — fundamental bank research. AI model outputs as of October 26, 2026 (silver spot about $54.02). These figures are updated daily by each platform and may have changed since.
MODEL NEXT 7–30 DAYS END OF 2026 2027 BIAS CoinCodex (live algorithm) $65.06 in 1 month (+20.5%) $71.55 (+32.5% vs. spot) $56.86 avg. in Dec 2027 (range $54.64–$59.65) Bullish near-term, bearish 2027 WalletInvestor $55.27 high / $53.40 low (14-day) $59.47 $68.13 (1-year, Oct 2027) Neutral (“Hold”), technical model LongForecast $48.95 end-Nov (range $42.05–$55.38) $45.92 (–15.0%) $59.37 Dec 2027 (range $40.49–$62.34) Bearish near-term, recovery in H2 2027 CoinPriceForecast $54.49 by Nov 3 / $55.20 by Nov 15 $57.91 (+7%) $65.46 mid-year / $78.98 year-end (+46%) Bullish, gradual uptrend
AI model outputs move with recent price momentum, so they can change sharply from week to week. Three things to keep in mind:
- Near-term (7–30 day) targets mostly extend the latest trend, so after a sell-off like September’s they tend to point lower, and after a rebound they can flip higher within days.
- Year-end and 2027 figures are statistical extrapolations: they do not model the Fed, the US dollar, solar thrifting or the supply deficit.
- Where AI models and bank forecasts agree, the signal is stronger; where they diverge widely, treat both with caution.
Note: Treat any single AI-generated silver price target as one data point among many, not a standalone forecast.
Silver Price History — The Most Important Moments
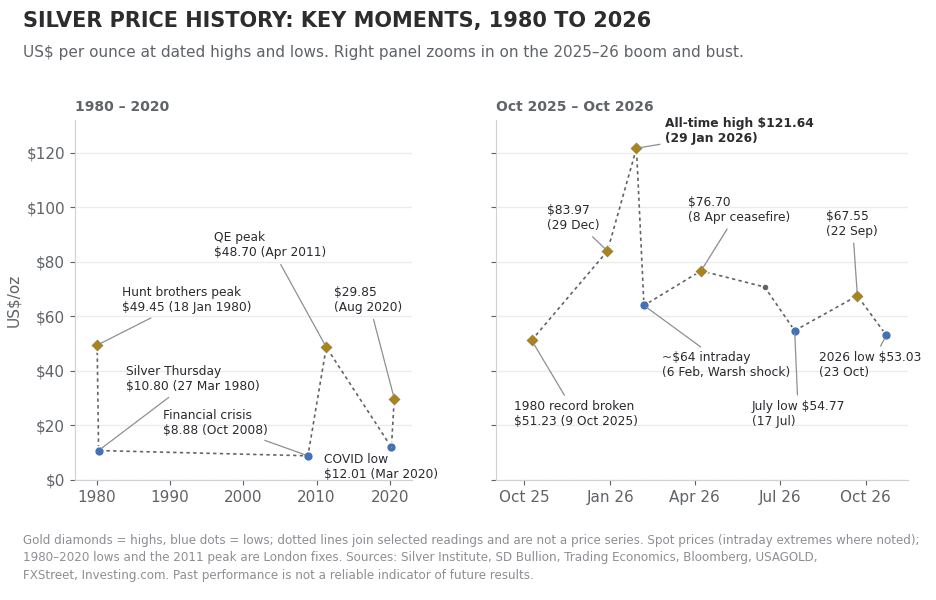
Silver's price history is a story of recurring speculative manias separated by long, quiet bear markets — and 2026 has already produced one of the most dramatic chapters in that nearly 50-year history.
1979–1980: The Hunt Brothers Corner and Silver Thursday
The defining event in silver's modern history. Texas oil billionaires Nelson Bunker Hunt and William Herbert Hunt accumulated an estimated 100–200 million ounces of silver — roughly a third of the world's deliverable supply outside government reserves — driving the price from $6.08 on January 1, 1979, to a then-record $49.45 on January 18, 1980 (with futures briefly touching $50.35 intraday). When the COMEX imposed emergency margin rules restricting purchases on credit, the brothers were unable to meet margin calls, and on March 27, 1980 — forever known as "Silver Thursday" — the price collapsed to $10.80, losing half its value in a single day.
2011: The Post-Financial-Crisis QE Rally
Riding a wave of post-2008 quantitative easing, dollar weakness, and the launch of major silver ETFs like iShares' SLV, silver rallied from an $8.88 financial-crisis low to $48.70 in April 2011 — briefly surpassing the Hunt Brothers' nominal record before pulling back sharply as the global economy stabilised and risk appetite normalised.
2020: The COVID Crash and V-Shaped Recovery
Silver fell to $12.01 in March 2020 as the pandemic triggered a global liquidity crunch and industrial demand collapsed alongside locked-down economies. The recovery was remarkably swift: by August 2020, silver had rallied to nearly $30 — a seven-year high — as massive monetary and fiscal stimulus reignited inflation-hedge and store-of-value demand, a pattern that would become a recurring theme through the 2020s.
October 2025: The 45-Year Record Finally Falls
After 45 years as the nominal ceiling, the 1980 Hunt Brothers record was finally broken in October 2025, when spot prices topped $51 on October 9 and went on to a record $54.48 on October 17 amid a severe London liquidity squeeze — one-month silver lease rates soared past 30%, signalling acute physical market stress as traders and arbitrageurs scrambled for metal.
January 26–29, 2026: The Parabolic Blow-Off to a New All-Time High
Silver's most explosive move in modern history came in the final days of January 2026. On January 26, the metal jumped as much as 15% intraday to about $117.69 — one of its biggest one-day moves in roughly 45 years — as the breach of the psychological $100 barrier triggered cascading forced liquidations among short-sellers. The rally culminated on January 29 at $121.64, the highest nominal silver price ever recorded, comfortably surpassing even the October 2025 breakout. The move was driven by a brutal physical supply-demand mismatch layered on top of the existing structural deficit, rather than pure speculation alone.
February 6, 2026: The Warsh-Shock Crash
The euphoria proved short-lived. Following President Trump's January 30 nomination of inflation-hawk Kevin Warsh as the next Federal Reserve Chair, silver collapsed from its $121.64 peak to around $64 intraday on February 6 — a drawdown of about 47% in just over a week, wiping out a substantial share of the January gains as markets violently repriced the expected pace of Fed easing.
June–October 2026: From Ceasefire Rally to a New 2026 Low
Silver rebuilt part of its losses in the spring, rallying 5% to $76.70 on the April 8 US–Iran ceasefire and 4% to about $70.75 on June 15 on reports of a peace deal. Neither move lasted. Silver fell below $60 for the first time since December 2025 on June 24 and hit $54.77 on July 17 as solar demand weakened and banks cut their forecasts. A rebound of about 15% in August faded after the Fed’s September 16 rate hike. Silver slipped below $60 again on October 7 and, after a hotter-than-expected US inflation report and a jump in oil prices, broke below its July low on October 22, falling to around $53 on October 23 — its lowest level since November 2025.
When looking for silver price predictions, it is important to remember that analysts' forecasts can be wrong — sometimes by extraordinarily wide margins, as this year’s deep cuts to 2026 silver forecasts demonstrate. Projections are based on fundamental and technical analysis of historical price movements; past performance and forecasts are not reliable indicators of future results. It is essential to conduct your own research. Your decision to trade depends on your attitude to risk, your expertise in the market, the spread of your investment portfolio, and how comfortable you feel about losing money. Never invest money you cannot afford to lose.
Sources:
- J.P. Morgan Global Research — Silver Price Forecast for 2026 and 2027 (August 2026)
- The Silver Institute — Global Silver Market Data
- USAGOLD — Daily Precious Metals Market Report
- Reuters via Kitco — Silver and gold forecasts, July 2026 analyst poll
- Kitco — LBMA conference delegate survey, October 2026
- Kitco — Deutsche Bank on silver demand destruction, October 2026
- FXStreet — XAG/USD technical analysis, October 2026
- Trading Economics — Silver price
Other Resources:
- Gold forecast & price predictions 2026
- Oil forecast & price predictions 2026
- Natural Gas forecast & price predictions 2026
- EUR/USD forecast & price predictions 2026
- Dow Jones forecast & price predictions 2026
- NASDAQ 100 forecast & price predictions 2026
- British Pound forecast & price predictions 2026
- Turkish Lira forecast & price predictions 2026
- USD to INR forecast & price predictions 2026
- Egyptian Pound forecast & price predictions 2026